This is an old revision of the document!
Table of Contents
Model Debugging
Sometimes when you are evaluating your model in SAMM the process is taking a very long time or the results that are produced are incorrect or not what you were expecting. Fortunately TOOL has a number of debugging options available that allow yo tou see which tools are currently be evaluated, display intermediary data and even ignore errors.
SAMM
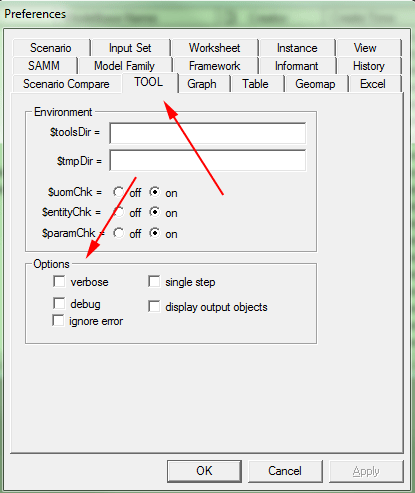
To access the debugging options in SAMM:
- Selecting the Preferences option in the File menu. This displays the Preferences window.
- Click on the TOOL tab.
The debugging options are found in the options group as seen in the image above
- verbose - displays the parser output before it is sent to TOOL in the TOOL console. This option is mainly a developer tool and not really useful for the average user.
- debug - displays the name of each tool being executed as well as the temporary file path in the TOOL console
- ignore error - ignores any errors that occur allowing you to complete the model evaluation. This option can be useful if you want to test portions of your model know that you model is not complete. However you need to be cautious when using this option. Remember to always inspect the results of your model.
- single step - displays each line of tool code that is about to be executed in the TOOL console and waits for user input before proceeding. Currently the option is to proceed to the next line by pressing the ENTER key.
- display output objects - displays the output of each line of tool code executed in either Table or Graph. The model will pause execution while Table or Graph is open and resume execution once it has been closed. The medium of display is specified by including the following in the tool.links file for the model account being used:
displayOutObj :
  table (or graph)
Note that each of these options can be used alone or in combination with one another depending on your requirements.
Documenter
You can also programatically activate the single step and display output objects debug features by adding the following lines of code in your Documeter code around the section of code you are interested in debugging.
$singleStep = on
$displayOutObj = on
  start of buggy code
  .
  .
  .
  end of buggy code
$singleStep = off
$displayOutObj = off
Note:
- you need to ensure that the tool.links is properly configured to call Table or Graph as soon above.
- once you change the code in Documenter you will need to re-load the calculator in SAMM
Beyond these features there are a number of tools that are useful for debugging your model.
- seeshape - many of the model errors that occur are the result of objects that are misshaped (i.e. the object has to many dimensions, not enough dimensions, the dimensions are out of order, the units of measure is inconsistent and/or the data type is inconsistent). As the name implies the seeshape tool displays the shape of the specified object allowing you to see how the object has been defined.
- table - sometimes the results produced are empty, unexpected or wrong. The table tool is useful for tracking the data through a procedure and examining the inputs and outputs of a line of code. By visualizing how the data is manipulated you can easily examine the formulas and logic you are trying to apply to your model.
- display - The display tool is similar to the table tool, however the display tool produces its output to the TOOL console and therefore does not stop the evaluation of the model. This tool can be particularly useful for debugging feedback views where pausing the model through each iteration would be slow and cumbersome.

